Your Safety Roadmap
Safety Roadmap and reportsWhat the Safety Roadmap shows, what the headline percentage means, and what's on each of its five tabs.
The Safety Roadmap is where your risk assessment comes together: where your camp stands, what you’ve committed to next, and whether it’s moving. It fills in by itself as your team works through the assessment, so there’s nothing to set up. Open it any time during the season.
Choose Safety Roadmap in the sidebar to open it. Everyone in your camp can see it.
Before you’ve started
If nobody has started the risk assessment yet, the roadmap shows Your roadmap builds itself as you work, with a link to Start your risk assessment. See Start your risk assessment.
Once the assessment has begun, the tabs fill in as risks are put on your register and rated.
The headline figure
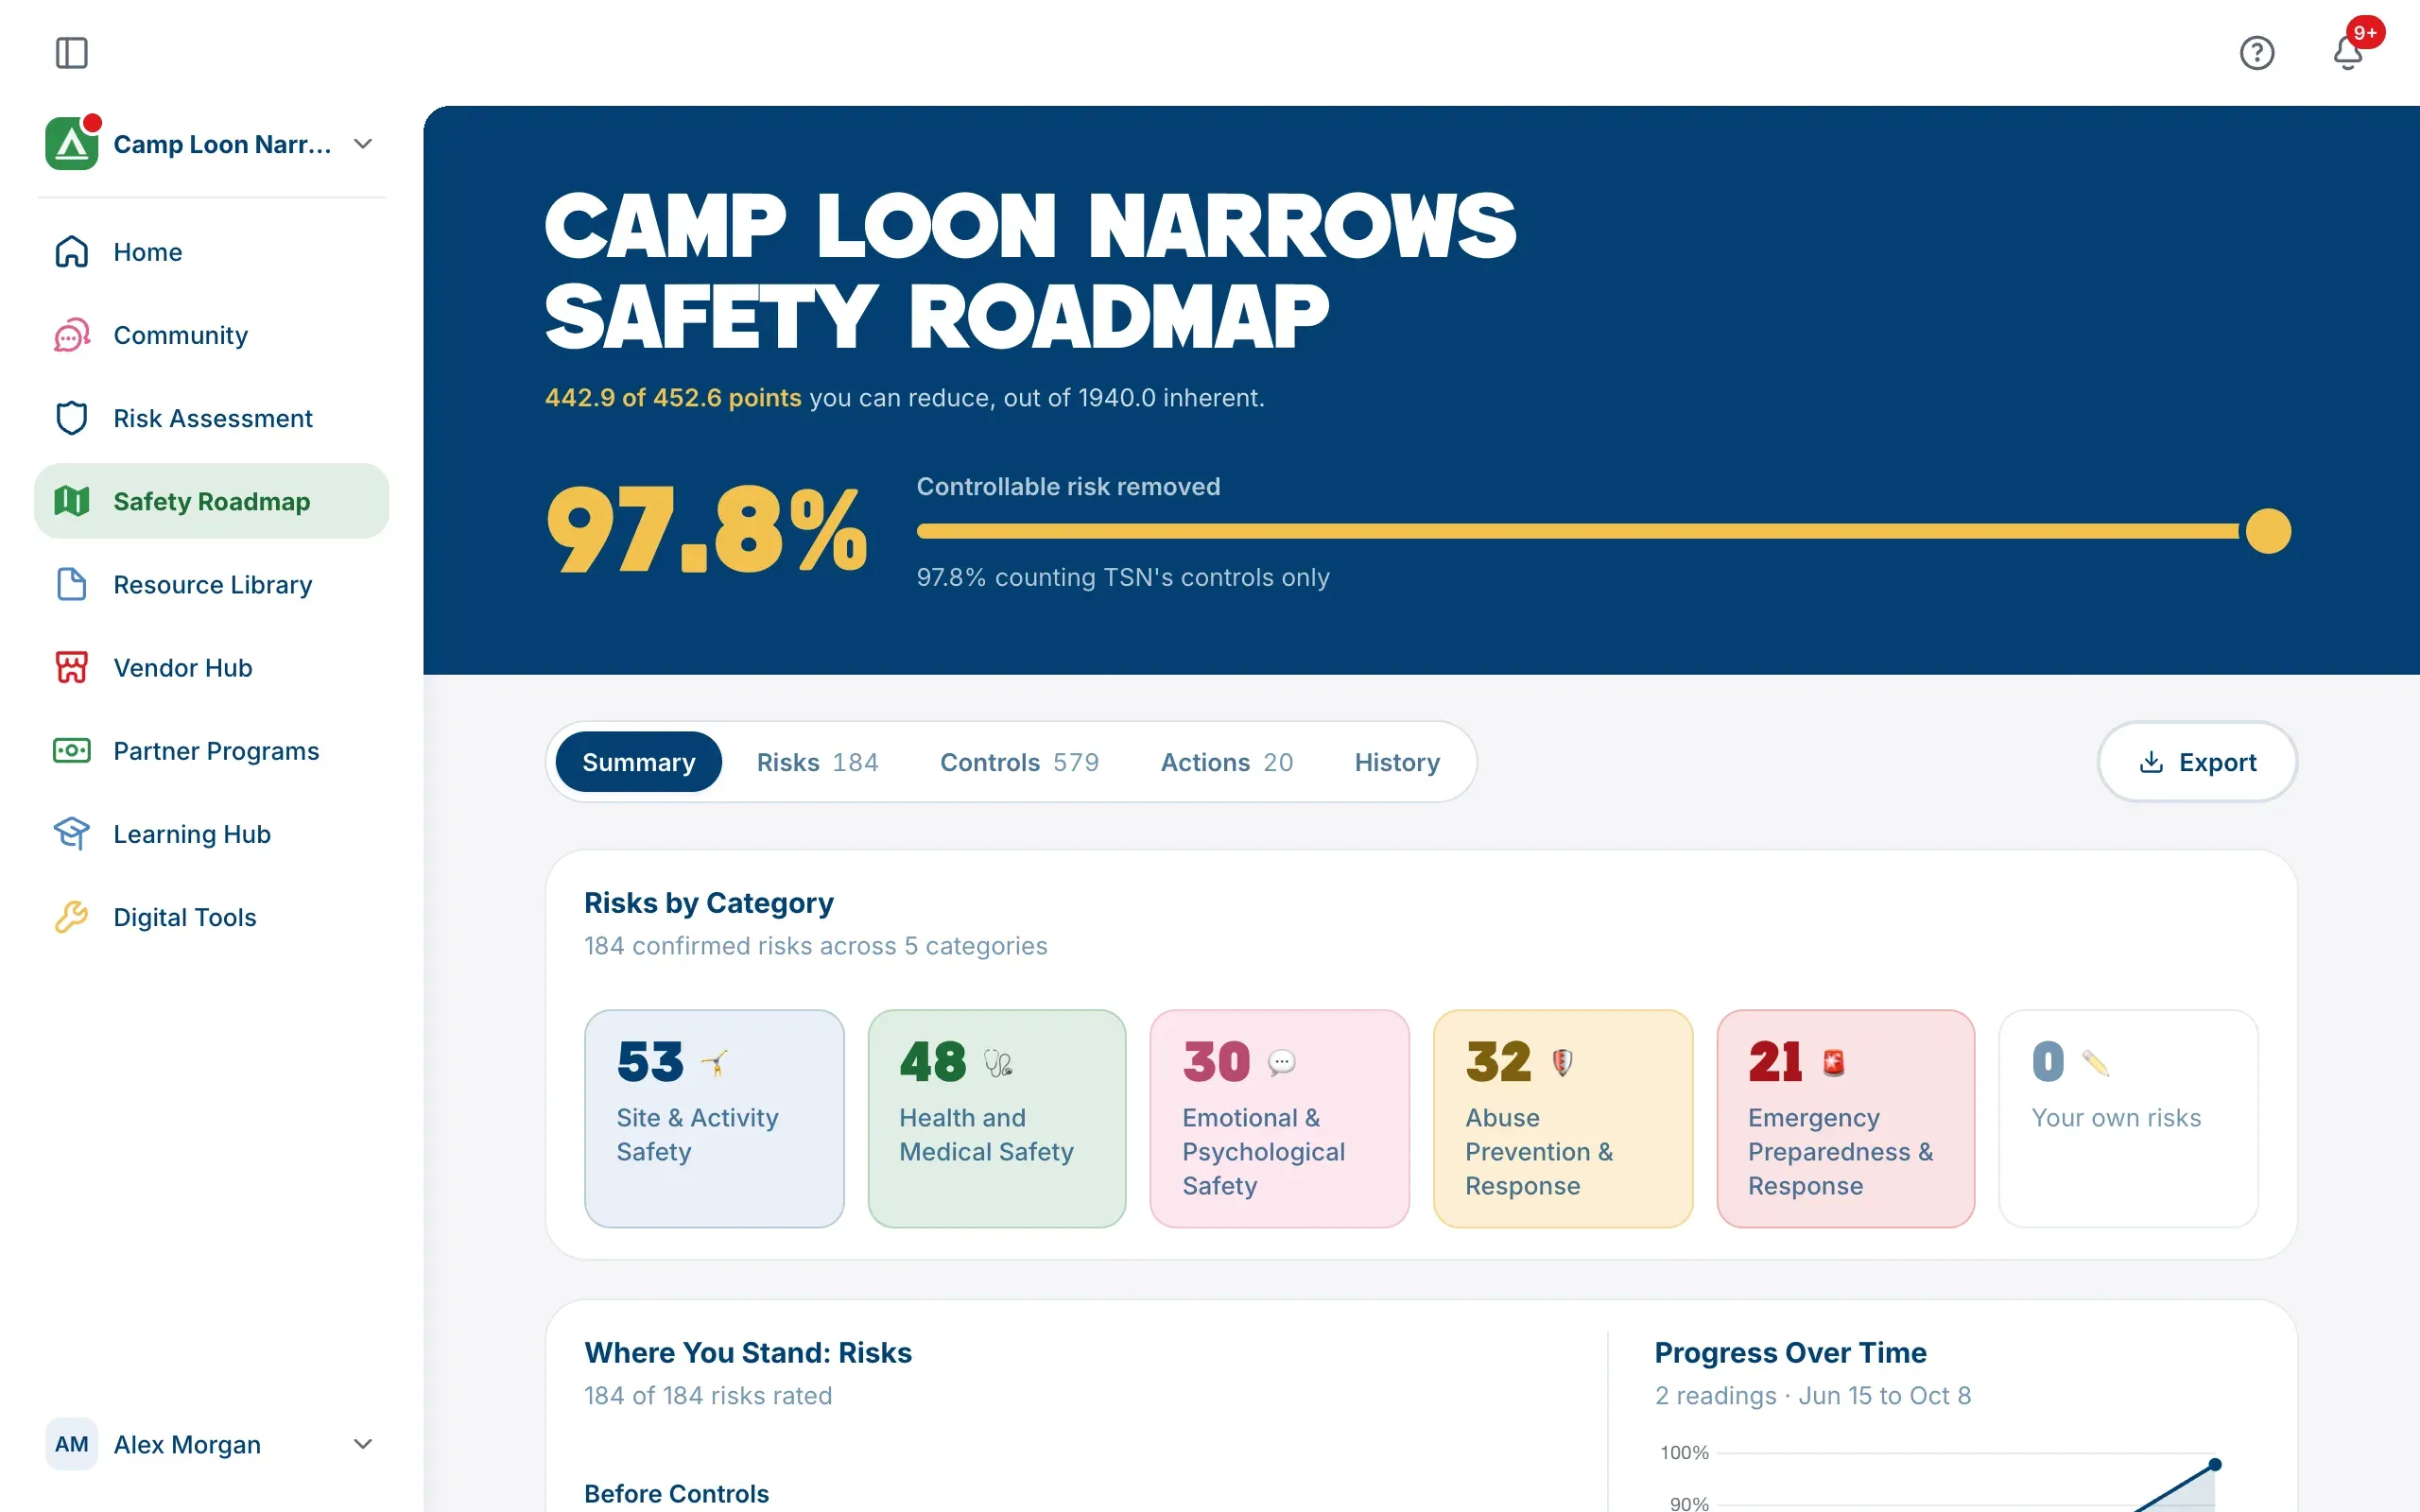
The blue band at the top shows your camp’s name and one figure: Controllable risk removed, as a percentage.
It answers one question: of the risk you could reduce with the controls you’ve answered, how much have you reduced? A camp that has everything in place that it answered reads 100%, even though no camp’s risk is ever zero.
Once you have more than one reading, the band also shows how much the figure has moved over the last three months or so, such as “2.4 since Sep 3”.
It’s your camp’s own measure of progress, built from your own answers. It isn’t a grade, an audit or a comparison with other camps. Elsewhere on the platform the same figure is called Safety Roadmap Progress.
Until you rate your first risk, the band says so instead of showing a figure.
The five tabs
The tabs sit under the band. Risks, Controls and Actions each show a count. On a phone the tabs are a drop-down menu instead.
Summary
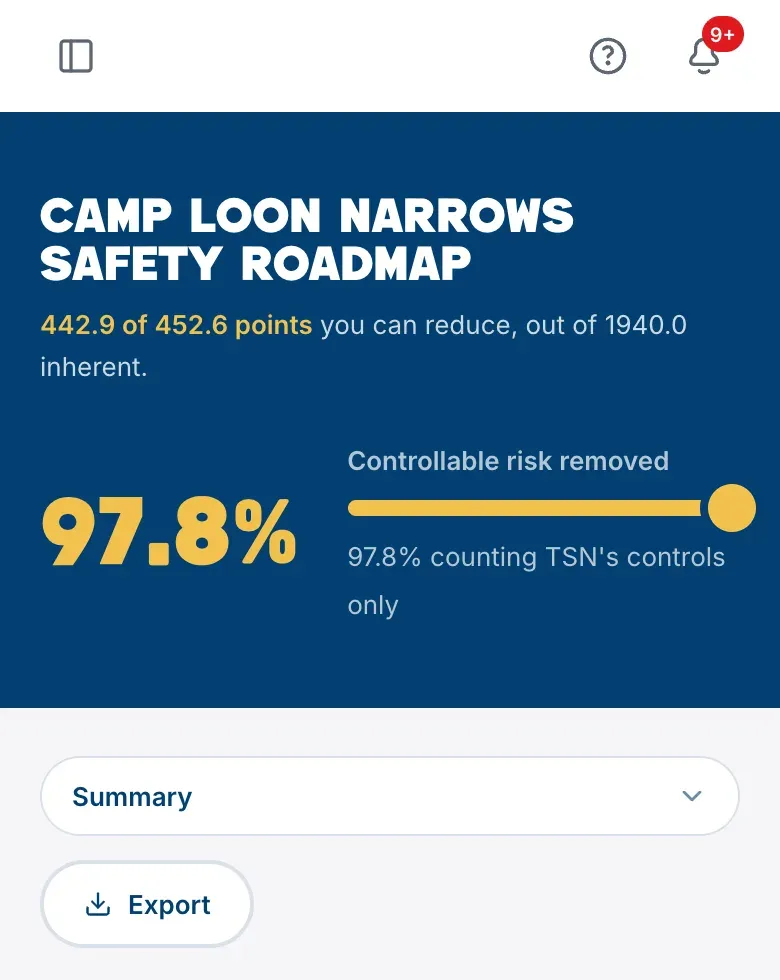
Everything at a glance:
- Risks by Category: how your confirmed risks spread across the categories.
- Where You Stand: Risks: three bars showing your rated risks by band Before Controls, With Controls You Have Today (Incl Partial) and If Every Control Were in Place.
- Progress Over Time: your headline figure over time, once there are readings to plot.
- Your Top 5 Risks Today: your highest-scoring risks with your controls counted.
- Top 5 Controls to Implement: the open actions that would bring your risk down most, whether or not they’re on your plan yet.
- Your Action Plan: your plan’s open actions, grouped by when they’re due. It’s read-only here; edit on the Actions tab.
Risks
Your full register. The switch at the top changes what every card on the tab shows: Before controls, Controls Today (Including Partial) or All Answered Controls in Place. The last is a projection of where you’d be if every control you’ve answered were fully in place.
The tab shows Risks by Severity Band, a Risk Matrix with every rated risk on its square, Your Top Risks, and Your Register, with each risk’s score before and after controls.
Controls
Every control you were asked about, and your answer to each:
- How many controls are Applicable to you, how many of those are Best practice in place (fully in place), and how many are Still open (partly in place or needed).
- Controls by Status: your answers, including any Not reviewed yet.
- Your Controls: the full list with each control’s type, what it’s worth and what it reduces. Group and order it however helps.
To change an answer, go to the Control stage of the risk assessment.
Actions
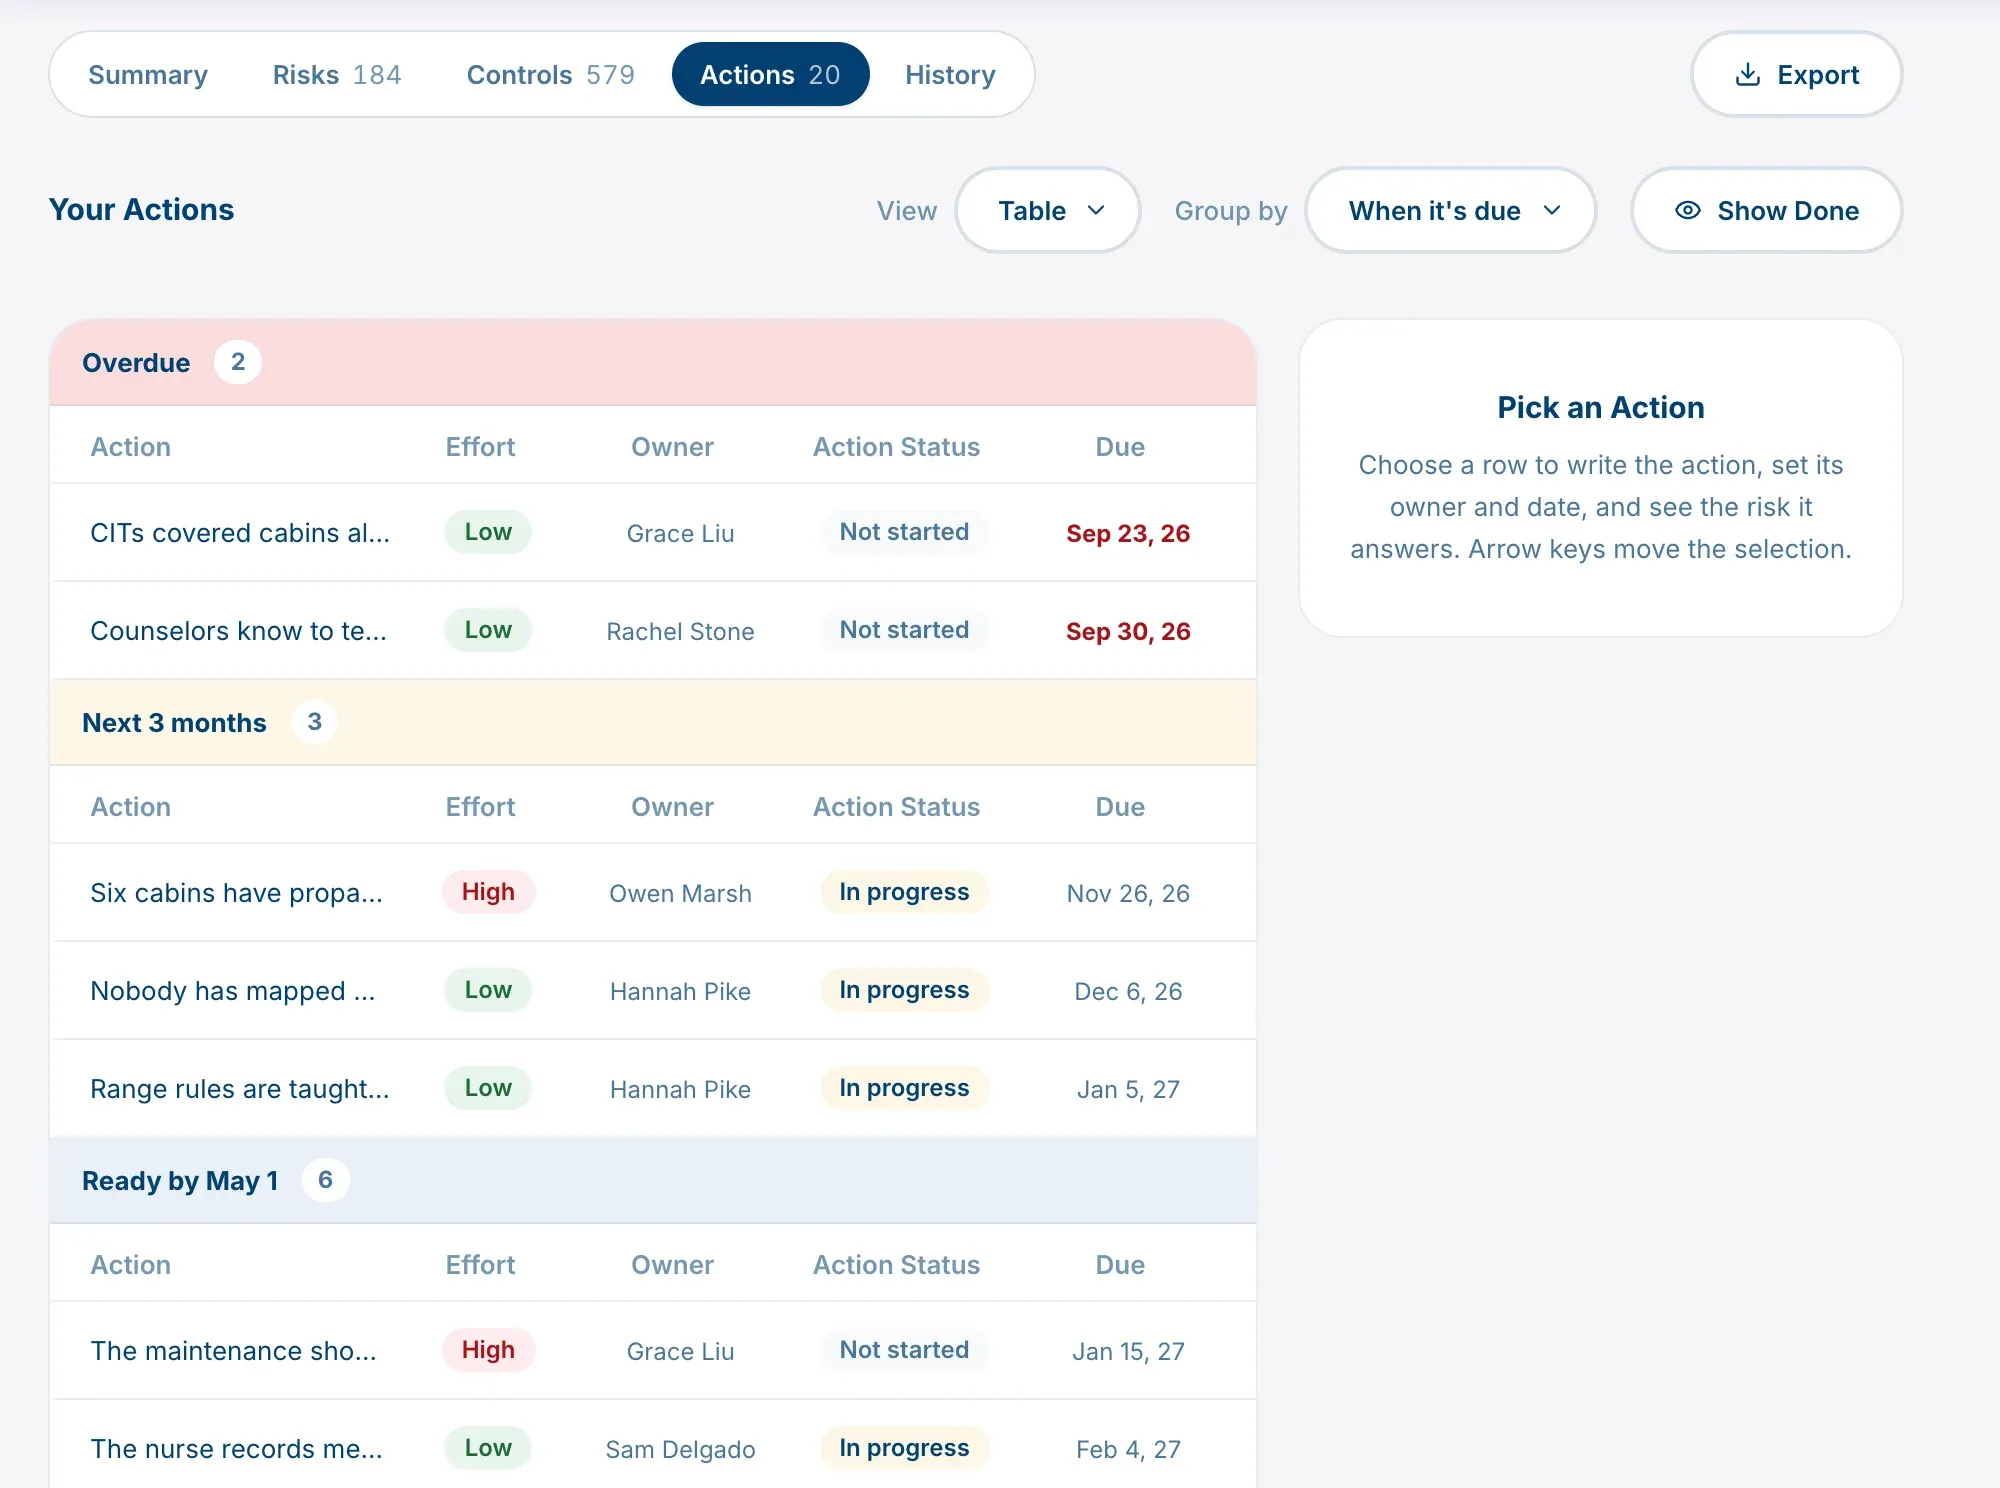
The actions you’ve published on your safety plan, and the one tab where you can change things. Under Your Actions:
- View: Table or Kanban.
- In the table, Group by When it’s due (Overdue, Next 3 months, Ready by May 1, Next 18 months, and Unscheduled), Priority, Risk, Owner or Nothing. Hide Done and Show Done hide or show finished actions.
- Click a row to open it and edit what you’re doing, the effort, the owner, the due date and the Action Status.
- In Kanban, the columns are the three statuses. Drag a card to another column, or use the status menu on the card.
Changes here are the same as changes in the Action stage. Marking an action Done sets its control to We have this and moves your headline figure. Actions still being planned appear here once they’re published. See Assign and track actions.
History
Compares where you are now with an earlier reading. See Track your progress over time.
Export a report
Export, beside the tabs, opens three reports you can print or save as a PDF, for your board, your staff or your families. See Export your reports.