Track your progress over time
Safety Roadmap and reportsHow the platform records readings of your risk assessment as you work, and how to compare today with an earlier reading on the History tab.
As your team works through the risk assessment, the platform takes readings: a record of where your camp stood at that moment, including your progress figure, your risks by band, your control answers and your actions. The History tab of your Safety Roadmap uses them to show how far you’ve come.
There’s nothing to set up and nothing to press. Readings are taken for you.
When a reading is taken
A reading is taken after your team makes a change, such as putting a risk on your register, answering a control, adding a control of your own, saving the camp profile, or marking an action done. It waits until nobody has made a change for a couple of minutes, or until you close or leave the page, so a busy session becomes one reading rather than dozens.
A few things to know:
- Your first reading is your baseline. It’s taken once you’ve rated your first risk. The work you did before that shows as your starting point.
- At most one a week. After a reading, the next one waits at least a week. Changes in between aren’t lost: the next reading includes them.
- Only when something changed. If nothing has changed since the last reading, no new one is taken.
- Readings can’t be edited or deleted. They’re a record of what was true at the time.
If your camp hasn’t worked on the assessment for a while, the platform keeps your record going on its own.
Compare today with an earlier reading
- Open Safety Roadmap and choose the History tab.
- In Compared With, use the Reading menu to choose the reading you want. Your baseline is chosen to start with, marked your baseline.
The card shows how many readings you have and the dates they cover.
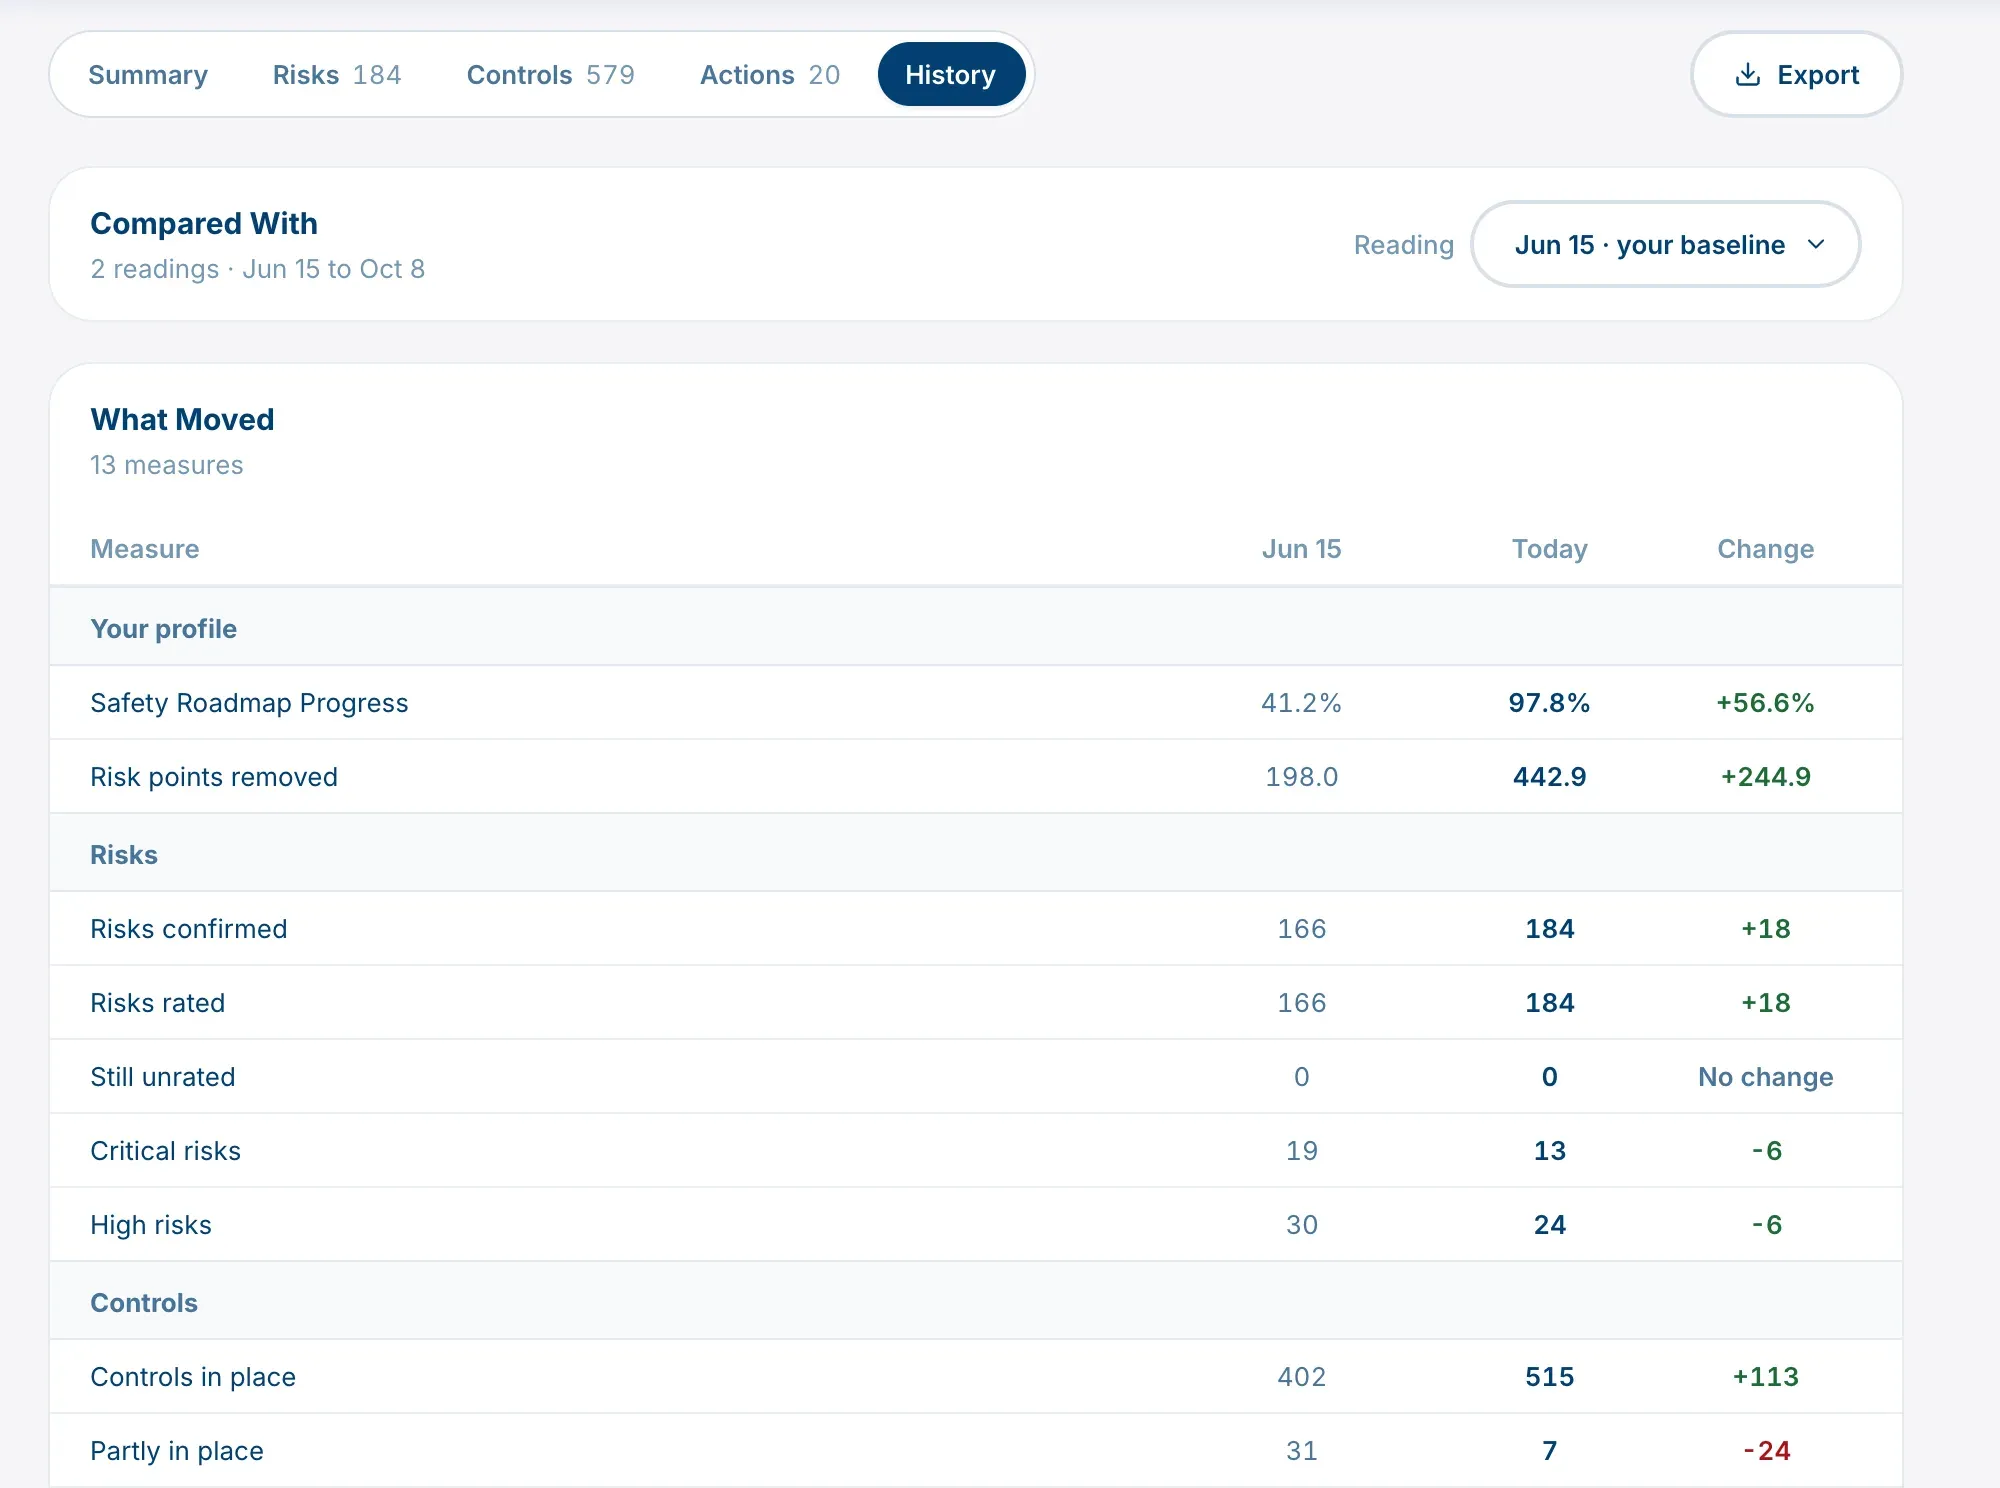
What the History tab shows
- What Moved: a table of measures, grouped under Your profile, Risks, Controls and Actions, with the reading you chose, Today, and the Change between them. It includes Safety Roadmap Progress, Risk points removed, how many risks are confirmed, rated and still unrated, how many controls are in place, partly in place or still needed, and how many actions are done, open or have nobody assigned.
- Risks by Band and Controls Answered: bar charts of the reading you chose next to today.
- Trend charts across every reading, including Both Progress Figures, Controls Over Time, Actions Over Time and Your Register Over Time.
Your progress figure also appears as Progress Over Time on the Summary tab.
Both Progress Figures
This chart draws two lines. Your figure is your headline progress. TSN’s controls only counts only the controls in TSN’s framework, leaving out any you added yourself. Where the two lines sit together, none of your progress rests on controls you wrote.
Before you have two readings
- With no readings yet, History says No Readings Yet. Rate your first risk and your baseline is taken.
- With one reading, History shows One reading so far and the date. There’s nothing to compare it with until a second reading is taken, at least a week later, once your team has made a change.

Gaps and breaks
- Not recorded then in the What Moved table means the platform wasn’t yet recording that measure when the older reading was taken. It stays that way for that reading, because readings can’t be changed.
- If TSN changed how controls are weighted between the two readings you’re comparing, a note under Compared With says so, because part of the change is ours rather than yours. The progress chart breaks at that point for the same reason.
History is a record, not a view of the past
History compares a past reading’s figures with today. You can’t open the whole roadmap as it looked on an earlier date. If you need to keep exactly what your roadmap showed at a moment in time, export a report and save it as a PDF. See Export your reports.